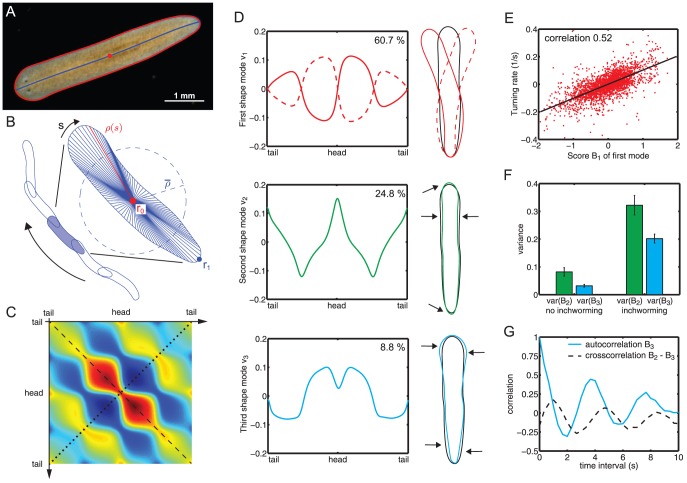
Figure 3. Three shape modes characterize projected flatworm body shape dynamics.
A. Our custom-made MATLAB software tracks worms in movies and extracts worm boundary outline (red) and centerline (blue). B. The radial distance  between the boundary points and midpoint of the centerline (
 , red dot) is calculated as a parameterization of worm shape. We normalize the radial distance profile of each worm by the mean radius
  . C. The second symmetry axis (dotted line) of the covariance matrix corresponds to statistically symmetric behavior of the worm with respect to its midline. D. The three shape modes with the largest eigenvalues account for 94% of the shape variations. The first shape mode characterizes bending of the worm and alone accounts for 61% of the observed shape variance. On the top, we show its normalized radial profile on the left as well as the boundary outline corresponding to the superposition of the mean worm shape and this first shape mode (solid red:
  , dashed red:
  , black: mean shape with
  ). The second shape mode describe lateral thinning (
 ), while the third shape mode corresponds unlike deformations of head and tail (
 ), giving the worm a wedge-shaped appearance. E. The first shape mode with score
  describing worm bending strongly correlates with the instantaneous turning rate of worm midpoint trajectories. F. We manually selected 30 movies where worms clearly show inch-worming and 50 movies with no inch-worming behavior. The variance of score
  and
and  increases for the inch-worming worms. G. The autocorrelation of mode
  and the crosscorrelation between mode
  and mode
  reveals an inch-worming frequency of approximately
  , hinting at generic behavioral patterns.

