
Figure 5. Principal component analysis for angular data using kernel PCA.
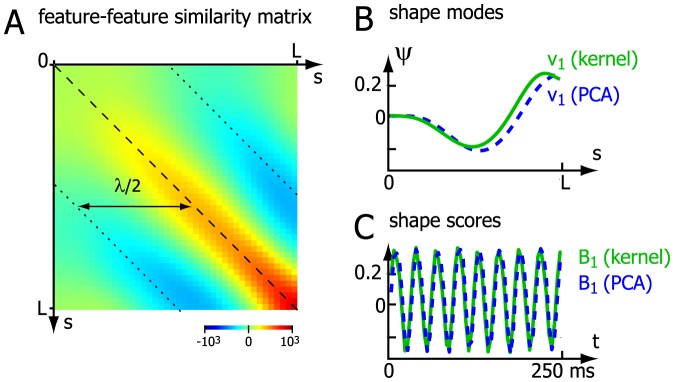
A. Centered feature-feature similarity matrix  according to eq. (6) for the sperm tangent angle data. B. First shape mode for the kernel method (green) compared to the first shape mode as obtained by linear PCA (blue dashed). C. Corresponding shape scores
  as a function of measurement time for both the kernel method (green) and for linear PCA (blue dashed).