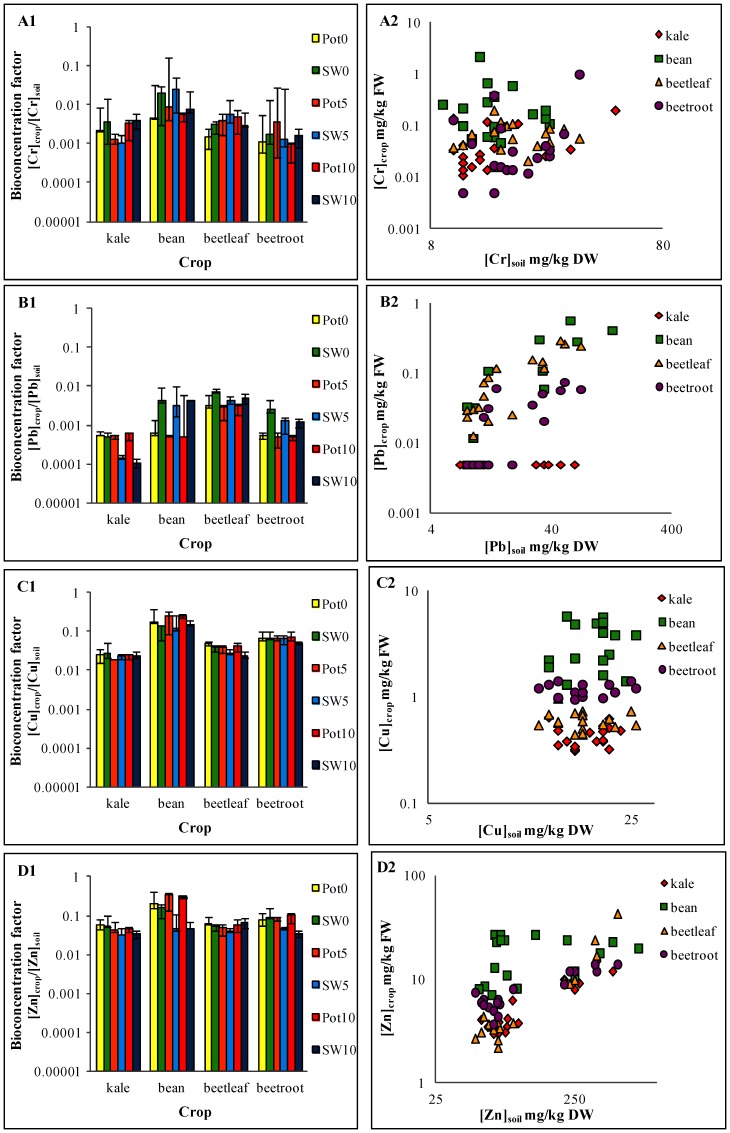
Figure 2. Bioconcentration factor for all crops (A1–D1) and relationship between soil and crop metal concentrations (A2–D2).
Bioconcentration factors, soil and crop concentrations are for (A) Cr, (B) Pb, (C) Cu and (D) Zn. Bioconcentration factors are the median for all potable and stormwater irrigated crops. The bars represent maximum and minimum concentrations recorded (n = 3). Note: Pot = potable water; SW = stormwater; the numbers 0, 5 and 10 in the legend represent the age groups 0 years, 5 years and 10 years, respectively; bioconcentration factor for crop samples below the detection limit (<0.01 mg/kg) was calculated as half the detection limit (0.005 mg/kg) divided by the soil concentration as per World Health Organisation (1995) http://www.who.int/foodsafety/publications/chem/en/lowlevel_may1995.pdf.

