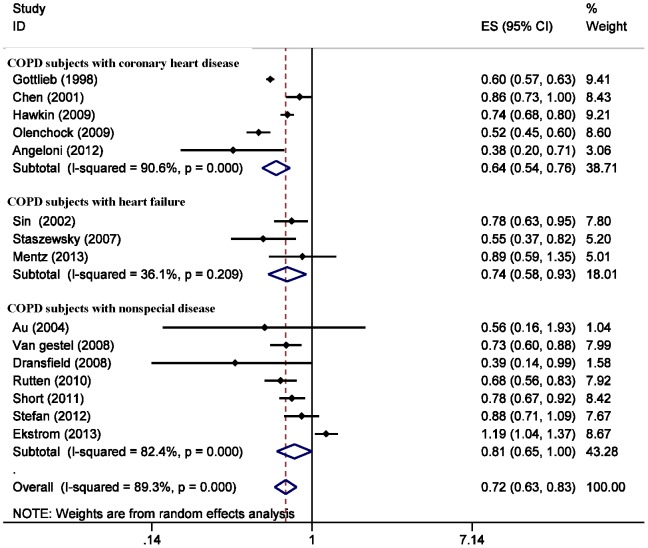
Figure 2. Forest plot showing beta-blockers use and mortality risk in COPD patients.
Three subgroups were analysis according to the comorbid conditions of COPD. This Forest plot represents the relative risk (RR) (95% confidence interval) for mortality in COPD patients treated with beta-blockers compared with controls. (see also weight values on the right).

