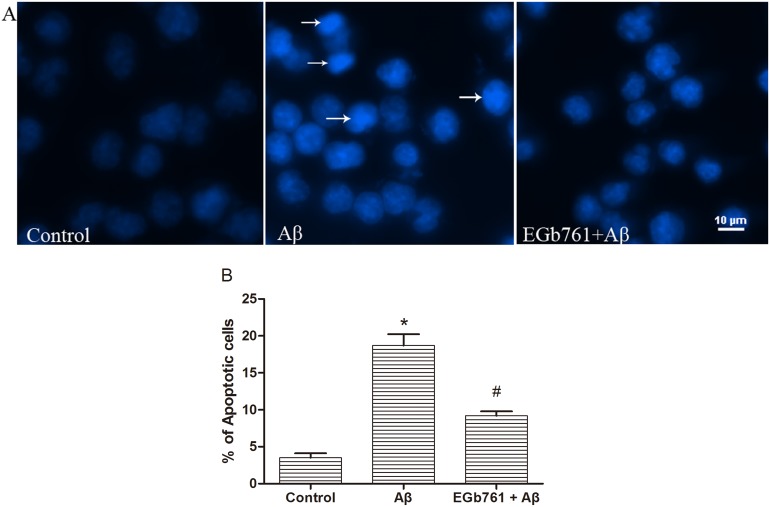
Figure 2. EGb761 prevented Aβ1 –42 oligomer-induced apoptosis.
bEnd.3 cells were incubated with or without EGb761 (100 µg/mL), followed by incubation with 10 µM Aβ1–42 oligomer for 24 h. Cells were then subjected to Hoechst-33258 staining and viewed under a fluorescence microscope. Arrows indicate apoptotic nuclei. The apoptotic nuclei appear shrunken, irregular and fragmented (arrows). Panel B shows the percentage of apoptotic cells. In each group, ten microscopic fields were selected randomly and counted. Results are shown as the Mean±S.E.M. (*p<0.01, Aβ versus Control; #p<0.01, EGb761+Aβ versus Aβ).

