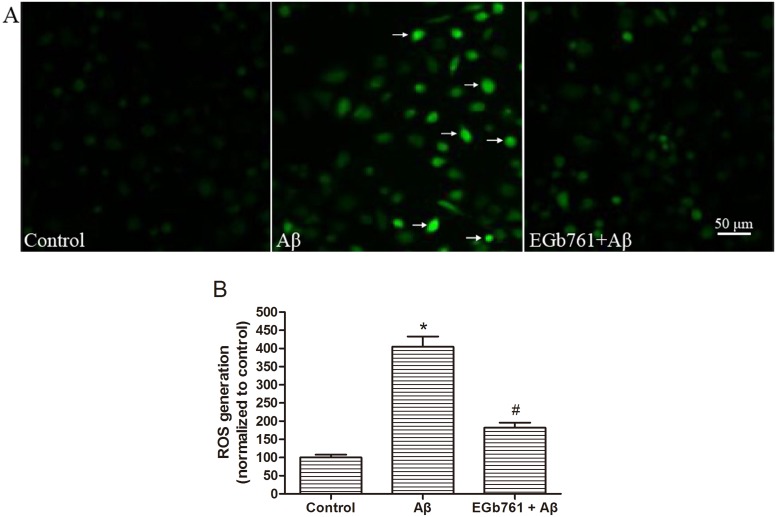
Figure 3. EGb761 attenuated the Aβ1 –42 oligomer-induced increase of ROS.
Panel A: ROS generation in bEnd.3 cells was evaluated by the oxidation of H2DCF-DA to DCF (Fig. 3A, Control) and assessed by inverted fluorescent microscopy (100×). Following treatment for 24 h with 10 µM Aβ1–42 oligomer, an increase in fluorescence was detected (Fig. 3A, Aβ). Cells treated with 100 µg/mL EGb761 for 2 h prior Aβ1–42 oligomer treatment for 24 h, showed a decrease in fluorescence (Fig. 3A, EGb761+Aβ). Panel B shows the relative levels of intracellular ROS quantified by a microplate reader (488 nm excitation and 525 nm emission), with the results normalized to the control (set at 100). Results are shown as the Mean±S.E.M. (*p<0.01, Aβ versus Control; #p<0.01, EGb761+Aβ versus Aβ).

