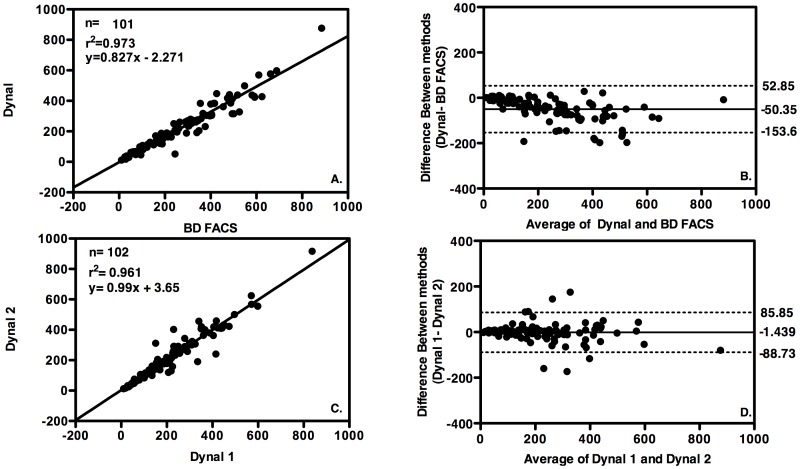
Figure 3. Accuracy and Precision of Dynal assay.
Linear regression analysis plots (right column) and Bland Altman bias plots (left column) with upper and lower 95% limits of agreement (LOA) shown as broken lines and mean bias shown as an unbroken line. A. and B. Dynal accuracy versus BD FACS in urban (reference) laboratory C. and D. Precision of measurements using the Dynal assay performed in duplicate by the same laboratory technician in urban (reference) laboratory.

