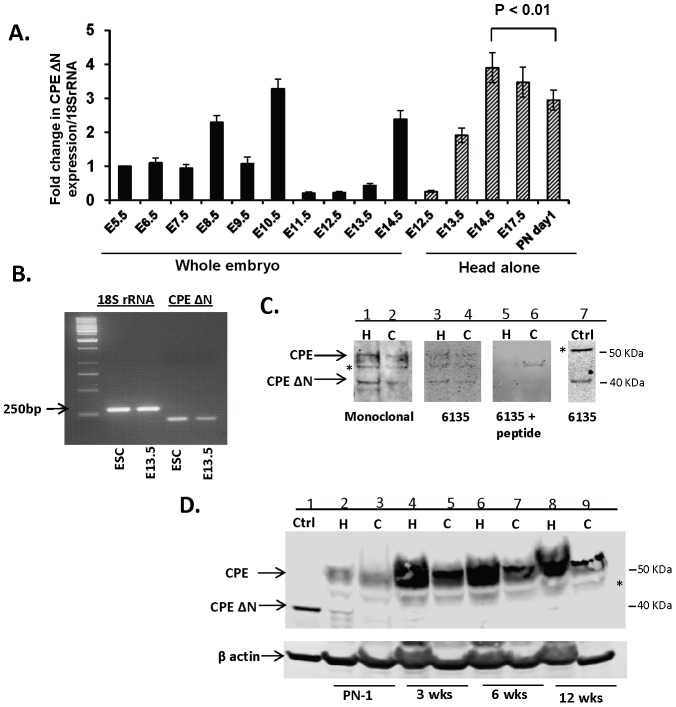
Figure 1. Expression of CPE-ΔN in embryos, embryonic neurons and adult brain.
A. Bar graph represents the fold change in CPE-ΔN mRNA levels in whole mouse embryos and head alone at gestational ages from E5.5–E17.5 and postnatal day 1 (PN1) compared to E5.5. Each bar represents results from 3 embryos or head, each one obtained from 3 individual mice. The RT-PCR was done in triplicates. Note the significant decrease in the CPE-ΔN mRNA levels from head of E14.5 embryos to PN1 mice (t test, n = 3, p<0.01). B. Semi-quantitative PCR of CPE-ΔN transcripts. Representative gel (n = 3) showing 18S rRNA and 200 bp CPE-ΔN transcripts from mouse E13.5 cortical cells and embryonic stem cells (ESC). C. Representative Western blot showing WT and CPE-ΔN protein in rat E18 hippocampal (H) and cortical (C) neurons visualized by 2 different antibodies: mouse monoclonal antibody, (lanes 1, 2), rabbit polyclonal antibody #6135 (lanes 3, 4) and absorption control using the antigenic peptide used to generate antibody #6135 (lanes 5, 6). A positive control (Ctrl) using HCC cells transduced with cpe-ΔN construct (lane 7). * denotes non-specific band. N = 3. D. Representative Western blot (N = 3) showing the expression of CPE-ΔN and CPE from hippocampus (H) (lanes: 2, 4, 6, 8) and cortex (C) (lanes 3, 5, 7, 9) of mice at PN1, 3, 6 and 12 weeks of age and positive control (Ctrl. using HCC cells transduced with cpe-ΔN construct) (lane 1), probed with mouse monoclonal antibody. * denotes non-specific band.

