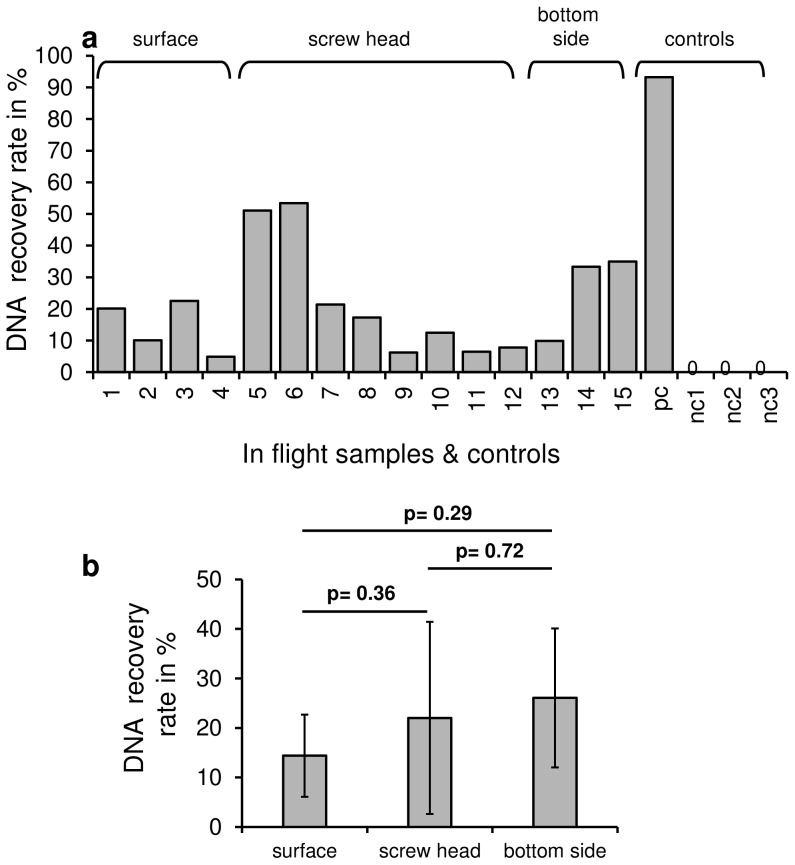
Figure 3. DNA recovery rate after re-entry and landing.
After post-flight payload retrieval, DNA samples were recovered and dissolved in Tris buffer. The DNA concentration was measured and the recovery rate was calculated with respect to the initial application concentration. DNA was detected in all the analyzed samples pc = positive control; nc = negative control a DNA recovery rate at single sample positions, b average DNA recovery rate for surface (n = 4), screw head (n = 8) and bottom side (n = 3) (SD, two-tailed unpaired t-test; p-values are shown for respective pairwise analyses).

