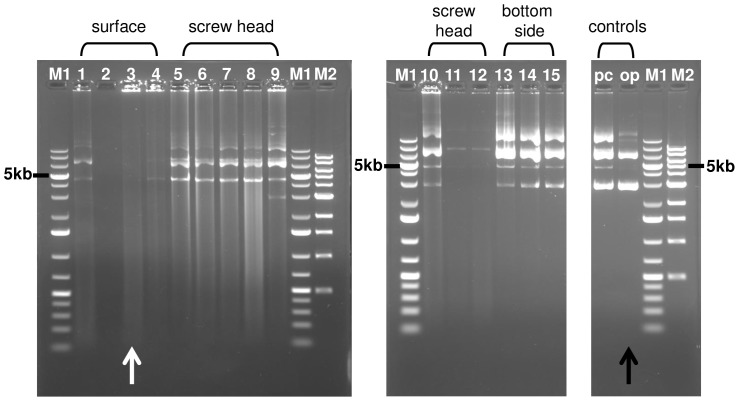
Figure 4. DNA quality analysis by agarose gel electrophoresis.
For each sample 250 ng of DNA was loaded on an agarose gel and the degree of degradation was analyzed after the run. The highest degree of degradation was recorded for samples 1–4, which were applied directly to the surface of the payload. For the samples applied in the grooves of the screw heads a lower degree of degradation was observed. DNA with the highest integrity was observed for the samples applied on the bottom side of the payload. The white arrow depicts the sample with the highest degree of degradation. The black arrow points to the lane where the original plasmid (op) was loaded. M1: Marker Gene Ruler 1 kb ladder; M2: Marker 1 kb DNA ladder; pc: positive control (9 days ground control).

