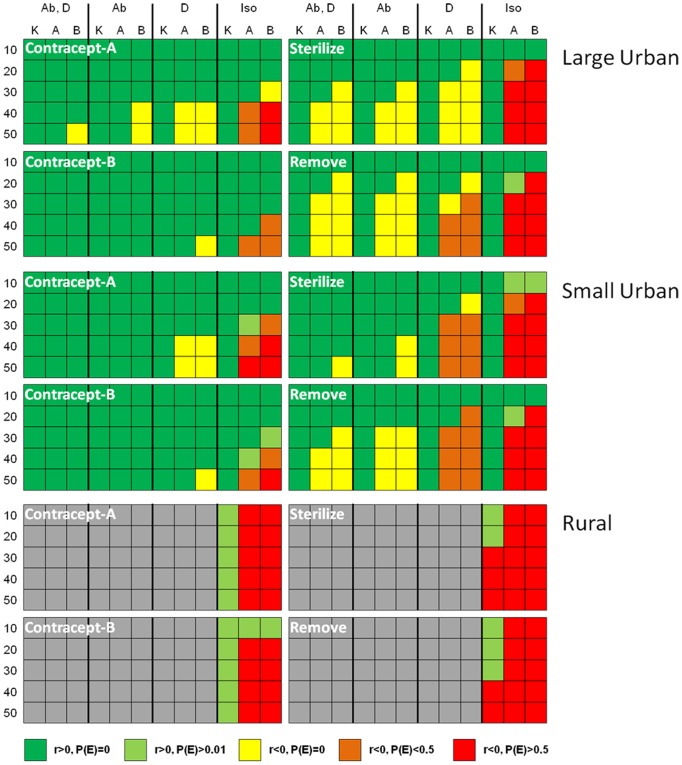
Figure 4. Comparative performance of simulated FRC management options across population types.
Row headings define the rate of treatment of individuals, as percentage of untreated kittens (K), adults (A), or both (B) treated each 6-month timestep. Column headings identify the inclusion of specific population connectivity characteristics in a given scenario: litter abandonment (Ab), dispersal to the surrounding neighborhood population (D), or population isolation (Iso). Each cell is color-coded based on the combined result of a specific model scenario, defined in terms of the mean stochastic growth rate (r) over the 50-year timeframe of the simulation and the risk of population elimination (P(E)) within that same time period (see color key at bottom of figure). Cells shaded gray represent scenarios that were not evaluated in this analysis.

