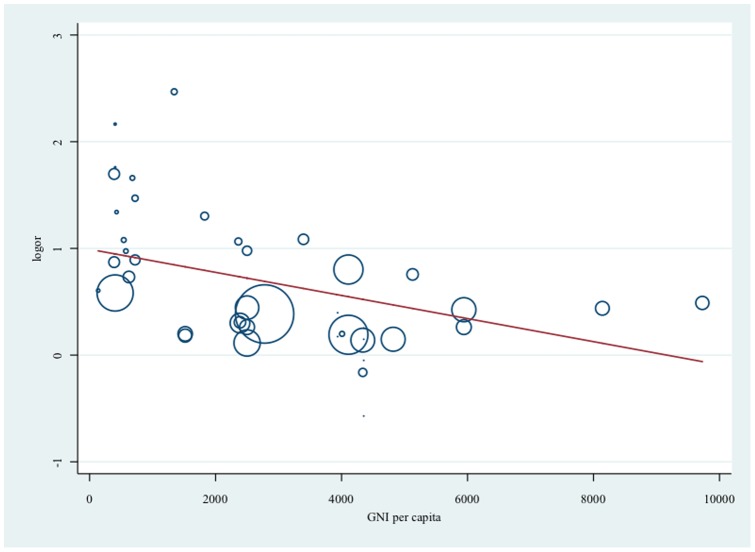
Figure 4. Association (log odds ratio) between living in an urban environment and obesity by GNI per capita.
Size of circles reflects sample size. Higher log odds ratio (logor) reflect larger effect size for living in an urban environment and obesity; gross national income (GNI) per capita in US dollar corresponding to year and country of fieldwork; Reference group is living in a rural environment.

