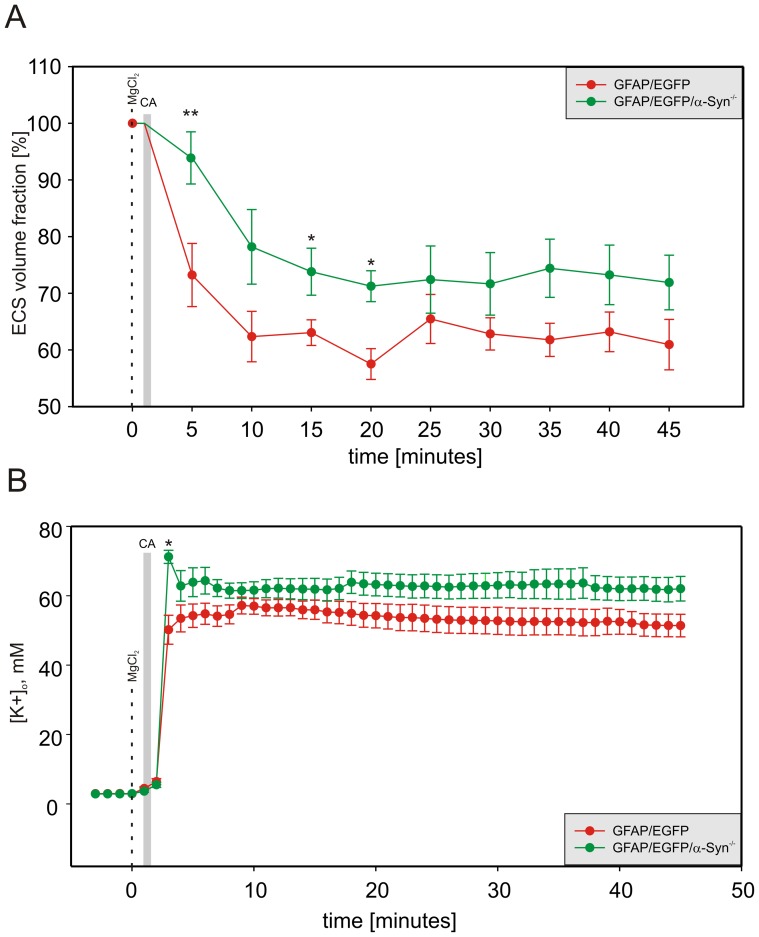
Figure 3. Relative changes in the ECS volume fraction and [K+]o evoked by terminal ischemia/anoxia in vivo.
Each data point represents mean ± S.E.M, calculated at 5 min intervals for ECS volume changes and each minute for [K+]o changes. The relative changes in the values of the ECS volume fraction α (A) after the onset of terminal ischemia/anoxia were significantly smaller and slower in GFAP/EGFP/α-Syn−/− mice than in GFAP/EGFP controls, but the final values did not differ. In contrast, the steep rise in [K+]o levels (B) was higher and faster in GFAP/EGFP/α-Syn−/− mice compared to GFAP/EGFP animals, with no difference in the final values. The gray bar indicates cardiac arrest (CA) and the dashed line indicates MgCl2 injection. Asterisks indicate significant (*, p<0.05) and very significant (**, p<0.01) differences between GFAP/EGFP and GFAP/EGFP/α-Syn−/− mice.

