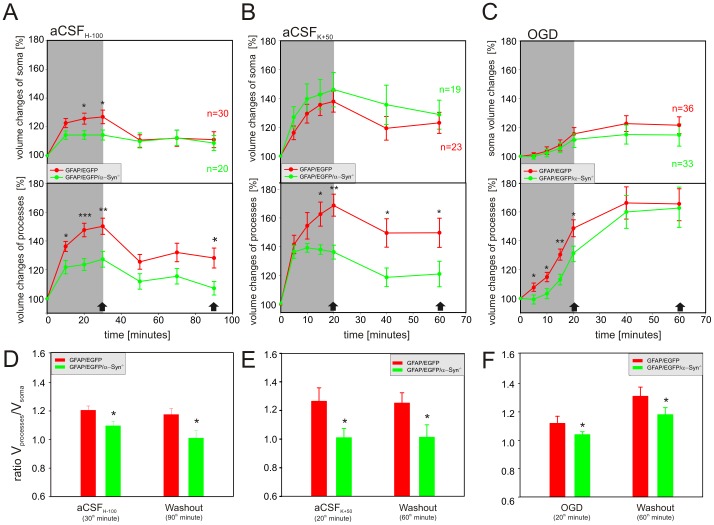
Figure 8. Volume changes in the astrocytic soma and processes during hypotonic stress, increased extracellular K+ concentration and OGD.
(A–C) Time-dependent changes in the volume of the astrocytic soma (top) and processes (bottom) in GFAP/EGFP (red) and GFAP/EGFP/α-Syn−/− mice (green) during a 30-minute application of aCSFH-100 (A), a 20-minute application of aCSFK+50 (B) or 20-minute OGD (C), followed by a 60- or 40-minute washout. (D–F) The contribution of the astrocytic soma and processes to the total astrocyte volume changes was expressed as a ratio of the volume changes of both compartments (Vprocesses/Vsoma) after 30 minutes of hypotonic stress and a subsequent 60-minute washout (D), after a 20-minute exposure to aCSFK+50 and a subsequent 40-minute washout (E), and after 20 minutes of OGD and a subsequent 40-minute washout (F). Note that in GFAP/EGFP mice the swelling of the astrocytic processes prevails (Vprocesses/Vsoma = ∼1.2), while in GFAP/EGFP/α-Syn−/− the ratio declines towards 1, indicating that the astrocytic processes swell less and the contribution of the cell soma to total astrocyte volume increases. The time-points at which the ratio was calculated are indicated by arrows in A–C. Asterisks indicate significant (*, p<0.05), very significant (**, p<0.01) and extremely significant (***, p<0.001) differences between GFAP/EGFP and GFAP/EGFP/α-Syn−/− mice.

