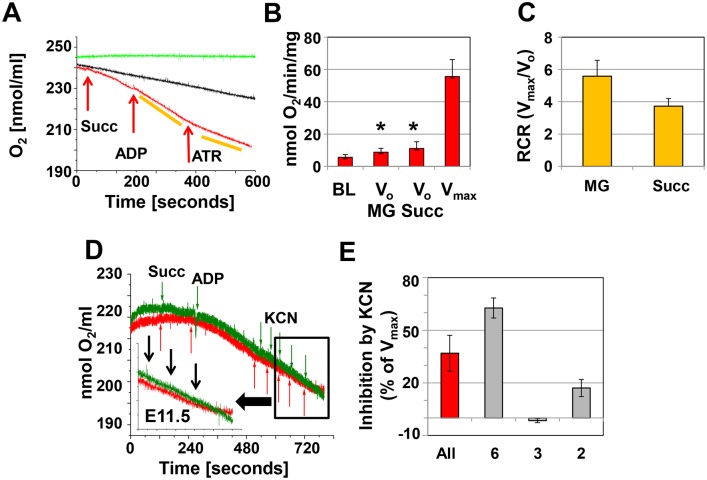
Figure 2. Oxygen consumption at E11.5.
A. Representative recording of oxygen consumption in cardiac tissue homogenates (approximately 20 µg protein in 0.3 ml respiration buffer). The red recordings represents the experiment and the arrows indicate the addition of 2 mM succinate (Succ.), 1 mM ADP and 0.1 mM ATR. The yellow bars indicate the slopes used to calculate oxygen consumption. The black recording represents the tissue homogenate in the respiration medium, but no additions to stimulate oxygen consumption are made. The green recording represents the buffer only. B. Bar graph illustrating oxygen consumption at baseline (BL), Vo (malate/glutamate (MG) and Succ), and Vmax. *indicates significance (p≤0.001, ANOVA Vo compared to Vmax). C. Respiratory control ratio, calculated as Vmax/Vo. A–C: n = 14 experiments, for each experiment 2–3 hearts were pooled. D. Representative recordings showing variable inhibition of oxygen consumption by potassium cyanide (KCN) added in 20 µM increments. Red recording: KCN is inhibitory, green recording: no inhibitory effect. E. Summary of KCN inhibition (n = 11; 3–4 hearts were pooled per experiment). All represents the composite data of all experiments, whereas the other columns represent data pooled from experiments with similar results.

