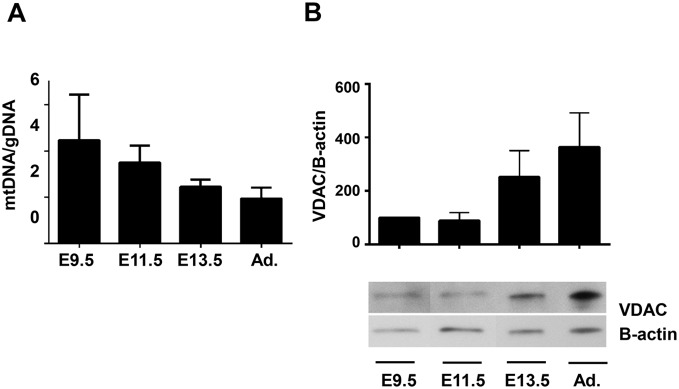
Figure 9. Mitochondrial biogenesis and mass measurements.

A. The ratio of mtDNA to gDNA, a measure of mitochondrial biogenesis, was measured in samples of E9.5, 11.5, 13.5 and adult hearts using qPCR to measure levels of CO1 (mtDNA) and 18s (gDNA). B. (Upper) Relative expression of VDAC and beta-actin were evaluated by densitometry and normalized to the value at E9.5 (100%). No significance was determined by ANOVA, n = 4. (Lower) Representative immunoblot demonstrating VDAC and beta-actin expression at each age. Note that lanes, which are not relevant to this manuscript, between E9.5 and E11.5 have been removed.
