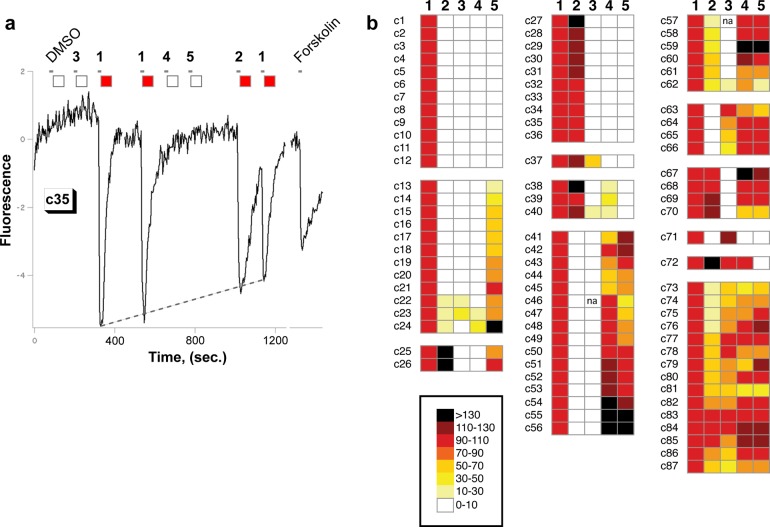
Figure 2.
Calcium imaging results for olfactory sensory neuron responses to compounds 1–5. (a) A representative calcium imaging trace, here depicting the cell c35 response. Broken line shows the octanal trend-line over the course of the experiment (see Methods). Small squares summarize the fluorescence response normalized to that of octanal, according to color scheme shown in panel b. The tick mark below each compound number marks the start of the 4 s injection of odorant solution into buffer stream flowing over cells. (b) Summary of responses for all octanal-activated cells to compounds 1–5 at 30 μM. (na, no data). Fluorescence changes are normalized to each cell’s response to compound 1, which is set to 100%.

