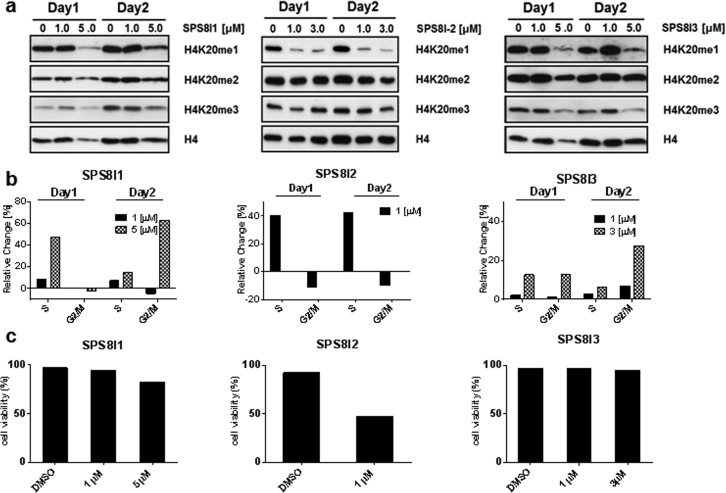
Figure 3.
Cellular inhibition of SETD8 by SPS8I1–3. (a) Western blot of the H4K20me mark upon treatment with SPS8I1–3. The HEK293T cells were treated with varied concentrations of SPS8I1–3 for 3 days (see Supplementary Figure S5 for Day 3). The level of H4K20me was examined as a cellular mark of SETD8’s methyltransferase activity with the levels of H4 and H4K20me2/3 as controls. (b) Cell cycle arrest phenotype associated with SPS8I1–3. HEK293T cells were treated with varied concentrations of SPS8I1–3 for 3 days. The cell cycle distributions of the treated cells were analyzed by flow cytometry. The distributions of cells in S phase and G2/M phase were plotted as their percentage changes in comparison with the DMSO-treated controls. (c) Viability of HEK293T cells treated with SPS8I1–3. HEK293T cells were treated with the varied concentrations of SPS8I1–3 for 3 days. Cell viability was determined by trypan blue staining with the DMSO-treated cells as the controls. Here the cells were treated with 0, 1, and 5 μM of SPS8I1 (left panel); 0 and 1 μM of SPS8I2 (central panel); 0, 1, and 3 μM of SPS8I3 (right panel).

