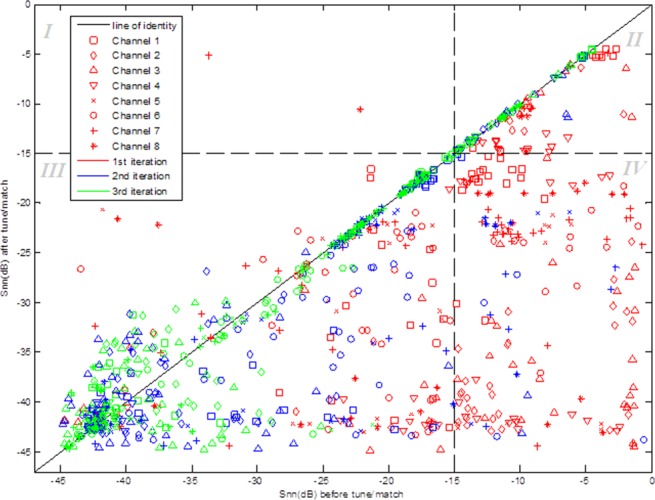
Figure 4.

Results of the evaluation of auto-tune algorithm performance on a phantom. The value of the S-parameter before the algorithm was run is plotted against that recorded after the tuning process. Points shown in red are data for the first iteration of the experiment, while the blue and green points are data for the second and third iterations, respectively. The concentration of points on or below the line of identity shows the positive effect of the tuning algorithm on the S-matrix. The plot is divided into four quadrants I–IV at the −15 dB cut-off in both dimensions.
