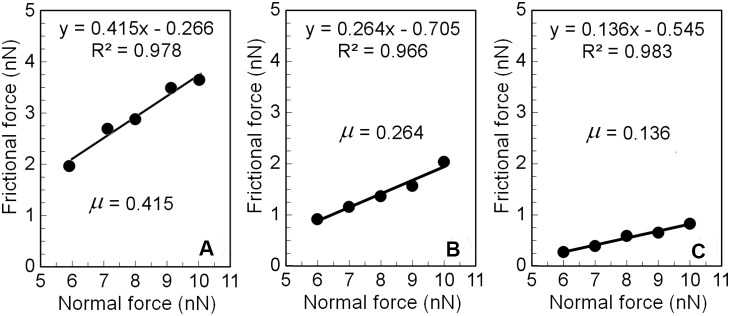
Figure 5. Representative plots of frictional versus normal forces for advanced OA cartilage measured in the lubricants of (A) PBS and, (B) HA 3.0 mg/ml, and (C) γ–globulin 2.0 mg/ml.

The linear slope yielding the AFM frictional coefficient measured for five values of the normal force in the range of 6–10 nN at an increment of 1 nN at each location.
