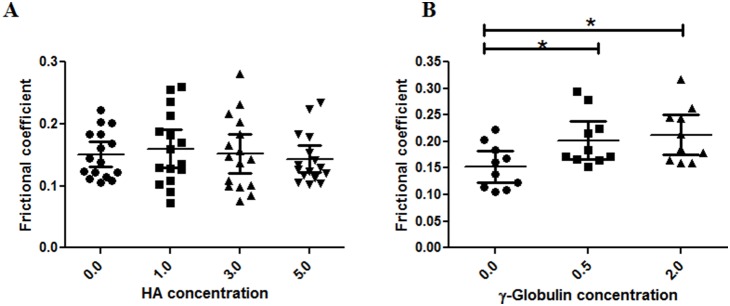
Figure 8. AFM measured frictional coefficients of early OA cartilage measured in a range of (A) HA (no of observation = 16) and (B) γ–globulin (no of observation = 10) concentrations.

In case of HA, no significant changes in frictional coefficient were observed. γ–globulin shows concentration based effect on frictional coefficient. The frictional coefficient values are from measurements at different locations on two samples of normal human cartilage from a single femoral head. Vertical bars represent the 95% of confidence interval. *P<0.01.
