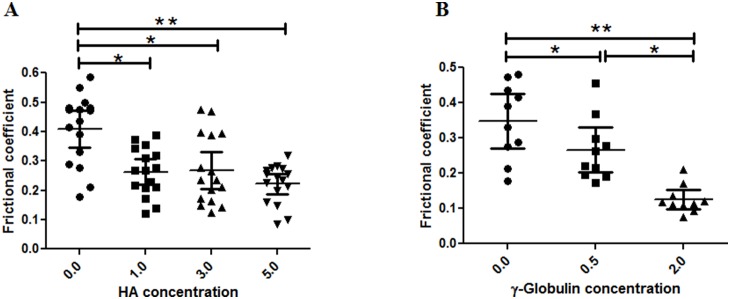
Figure 9. AFM measured frictional coefficients of advanced OA cartilage measured in a range of (A) HA (no of observation = 16) and (B) γ–globulin (no of observation = 10) concentrations.

Increased concentration of HA and γ–globulin shows a decrease in frictional coefficients of advanced OA cartilage samples. The frictional coefficient values were from measurements at different locations on two samples of advanced human cartilage from a single femoral head. Vertical bars represent the 95% of confidence interval. *P<0.01 and **P<0.0001.
