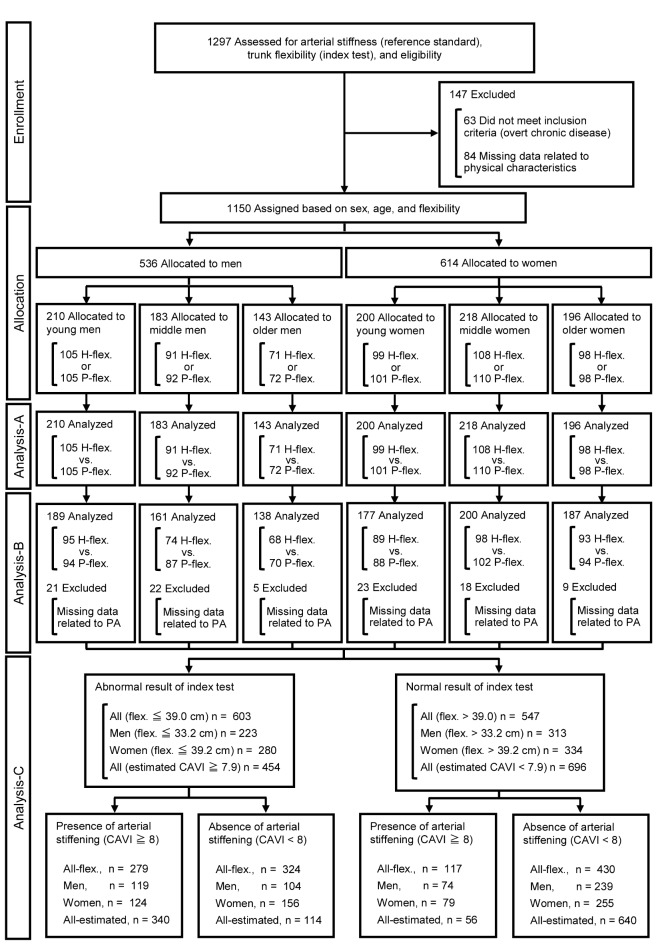
Figure 1. Flow diagram of study participants.
Analysis-A comprised ANOVA, ANCOVA, and Pearson's correlation. Analysis-B comprised univariate and stepwise multiple regression analyses. Analysis-C comprised determination of diagnostic criteria using ROC curve analysis and then assessment of flexibility as a diagnostic test. CAVI, cardio-ankle vascular index of arterial stiffness; estimated CAVI, value of CAVI estimated by multiple regression equation; flex, flexibility; H-flex, high-flexibility; P-flex, poor-flexibility; PA, amount of physical activity.

