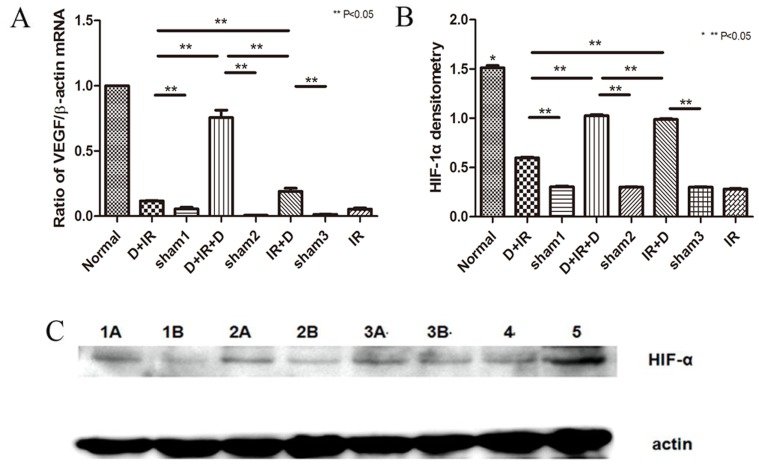
Figure 8. DFO administration improved angiogenesis in irradiated tissue via activating HIF-1α-VEGF Pathway.
A: Real-time PCR detection of VEGF expression 90 days after irradiation. B: Western-blot analysis of HIF-1α in tissues received DFO. Sham1: Pre-sterilized water group; sham2: Pre+Post sterilized water group; sham3: Post-sterilized water group. Data is presented as means ± SEM. *: P<0.05 compared with normal group; **: P<0.05 between two individual groups. C: HIF-1α in each group. Annotate: 1A represents D+IR group; 1B represents sham1; 2A represents IR+D group; 2B represents sham3; 3A represents D+IR+D group; 3B represents sham2; 4 represents IR; 5 represents normal group; β-Actin represents reference.

