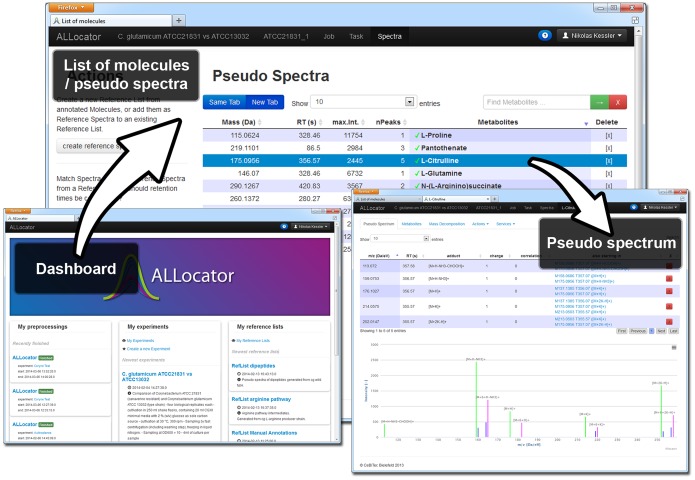
Figure 3. Screenshots from the ALLocator web platform user interface;
bottom left: the dashboard that servers as a starting point after log-in; top: The list of molecules or pseudo spectra that were detected in a certain chromatogram; bottom right: A pseudo spectrum view that provides a table of all adducts and fragments, as well as a spectral view of all contributing peaks.

