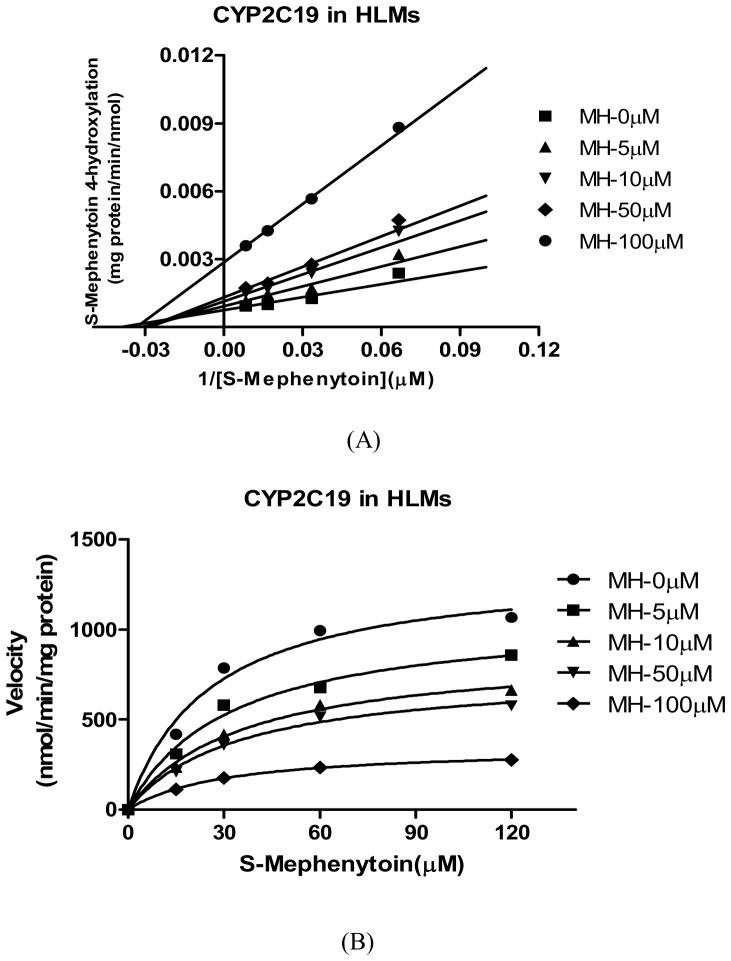
Figure 7. Double reciprocal (Lineweaver-Burk) plots for direct inhibition of S-Mephenytoin 4-hydroxylation (A) and Ki values (B).
Note: The inhibition of CYP1A2 activity by MH can be best described as a full competitive inhibition by different concentrations of MH (0–100 µM) in HLM incubations (0.5 mg·mL-1 protein). The data points are mean values of triplicate incubations. Non-linear regression analysis of the S-Mephenytoin 4-hydroxylation versus substrate concentration was performed to obtain Ki values.

