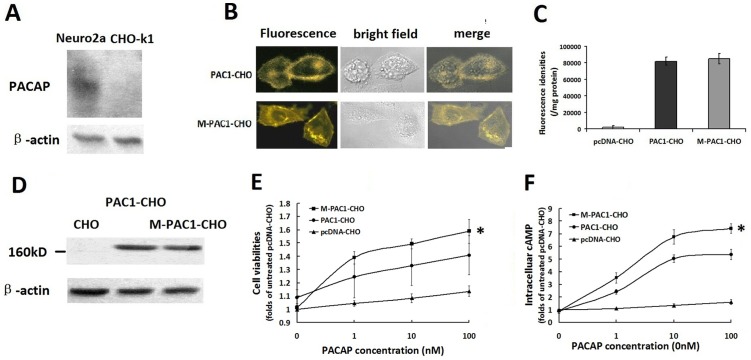
Figure 2. The ligand-dependent activation of PAC1 and M-PAC1 by PACAP.
(A) Western blotting of endogenous PACAP in CHO-K1 and neuro2a cells. As shown CHO-K1 had no detectable endogenous PACAP, while neuro2a cells produced endogenous PACAP. (B) The expression of PAC1-YFP and M-PAC1-YFP detected by immunofluorescence. Shown were immunofluorescence results of PAC1-CHO and M-PAC1-CHO cells cultured in DMEM with 0.5% CS-FBS at 37°C overnight, which indicated that both PAC1 and M-PAC1 trafficked normally to the plasma membrane and 0.5% CS-FBS induced no significant receptors endocytosis. (C) Fluorescence densities assays. Shown were the YFP fluorescence densities in the whole cell lysate detected using the Victor3 1420 multi-label counter with excitation (460±30 nm) and emission (535±30 nm), indicating that the expression levels of PAC1-YFP in CHO cells were equal to those of M-PAC1-YFP. (D) Western blotting assays using reductive SDS-PAGE. Western blotting with a goat polyclonal IgG against the C-terminus of PAC1 in the reductive condition showed that there were similar bands with the molecular weight about 160 kD in PAC1-CHO and M-PAC1-CHO, but not in CHO. (E) The cell viabilities of PAC1-CHO and M-PAC1-CHO cells promoted by PACAP. The data were plotted as the fold changes of the treatment without PACAP (0 nM). After the cells were submitted the addition of PACAP (1–100 nM) in the absence of CS-FBS for 24 h, MTT assays showed that PACAP exerted more significant proliferative effects on M-PAC1-CHO than on PAC1-CHO (*, P<0.01, M-PAC1-CHO vs. PAC1-CHO), indicating that the activation level of PAC1 by PACAP was lower than that of M-PAC1. (F) The intracellular cAMP levels induced by PACAP (1–100 nM) in PAC1-CHO and M-PAC1-CHO cells. After the data were plotted as the fold changes of the treatment with 0 nM PACAP, it was shown that the intracellular cAMP levels in M-PAC1-CHO cells induced by PACAP were significantly higher than the intracellular cAMP levels in PAC1-CHO cells induced by PACAP (*, P<0.01, M-PAC1-CHO vs. PAC1-CHO). The data were represented as the means ± S.E. of three independent experiments.

