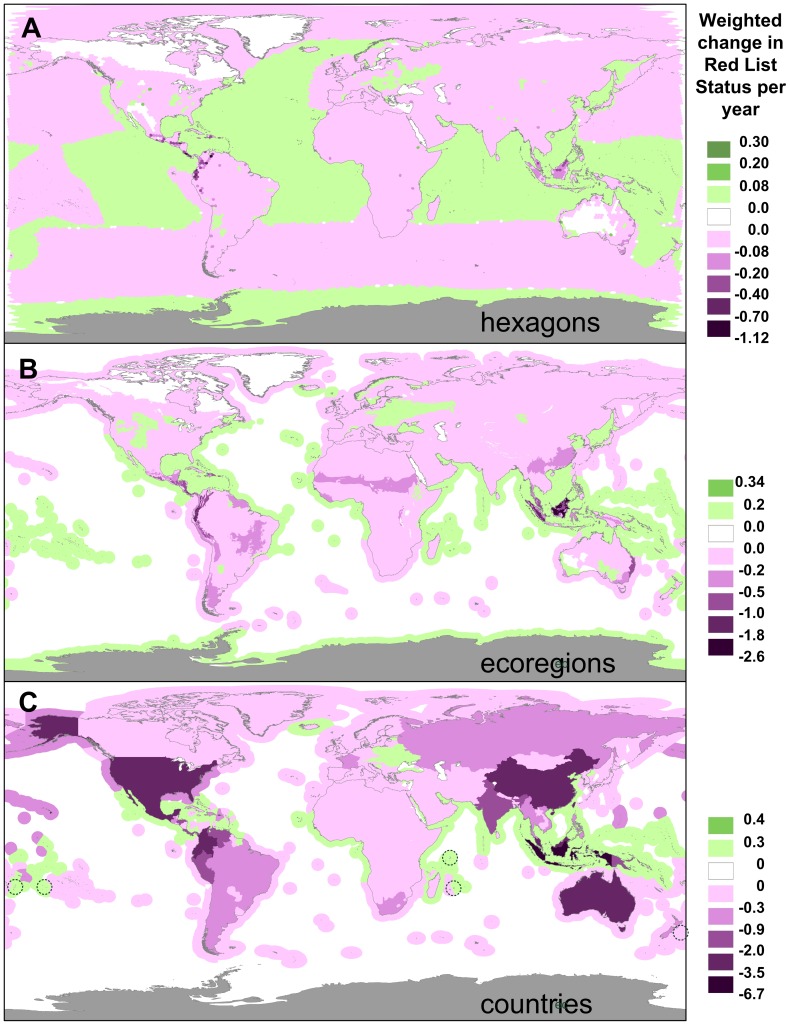
Figure 1. Spatially explicit trends in the global conservation status of vertebrates.
Mapped as the variation across space in the weighted change in Red List status per year, across three types of spatial units: hexagons (equal-area, ∼23,322 km2), ecoregions (large biogeographic units). and countries (grouped according to sovereignty; e.g. New Caledonia within France). Magenta corresponds to spatial units that have made a net negative contribution to the global vertebrate conservation status as measured through the Red List Index, green to units that made a net positive contribution; grey regions (Antarctica) have no species. In (C), the island nations of Tonga, Cook Islands, Seychelles, Mauritius and Fiji (all with positive weighted change in the Red List status per year) are indicated by a dashed circle.

