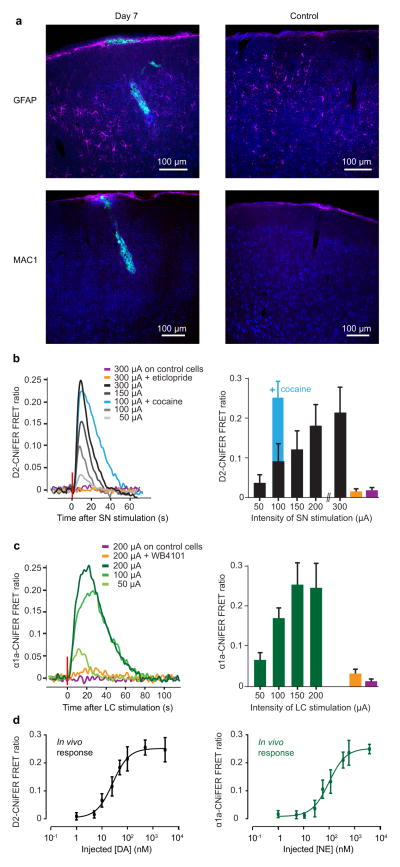
Figure 3. In vivo characterization of D2- and α1a-CNiFERs.
(a) Immunostaining for GFAP (magenta, top panel), MAC1 (magenta, lower panel) and NeuroTrace® (blue), in coronal sections. Left, mouse perfused 7 d after the injection of CNiFERs (green) in the frontal cortex. Right, control mouse with a similar optical window but no CNiFER injection. (b) D2-CNiFER FRET responses (evoked in frontal cortex by increasing amplitude of SN electrical stimulation before (black and grey, n = 4) and after i.p. injection of D2-receptor antagonist eticlopride (1mg/kg, orange, n = 3) or the DA reuptake inhibitor cocaine (15 mg/kg, blue, n = 3). Purple, response of control CNiFER to high amplitude stimulation. Left, example of raw traces used to calculate average peak responses (right) for each stimulation intensity. (c) α1a-CNiFER FRET response (green, n = 3) evoked by LC stimulation before (green) and after i.p. injection of α1a-receptor antagonist WB4101 (2mg/kg, orange, n = 3). Purple, response of control CNiFER to high amplitude stimulation. Example traces (left) and average peak responses (right). Error bars represent standard deviation. (d) Left, in vivo dose response curve for D2-CNiFER (black, n = 4). Right, in vivo dose response curve for α1a-CNiFER (green, n = 4). Error bars represent standard deviation.

