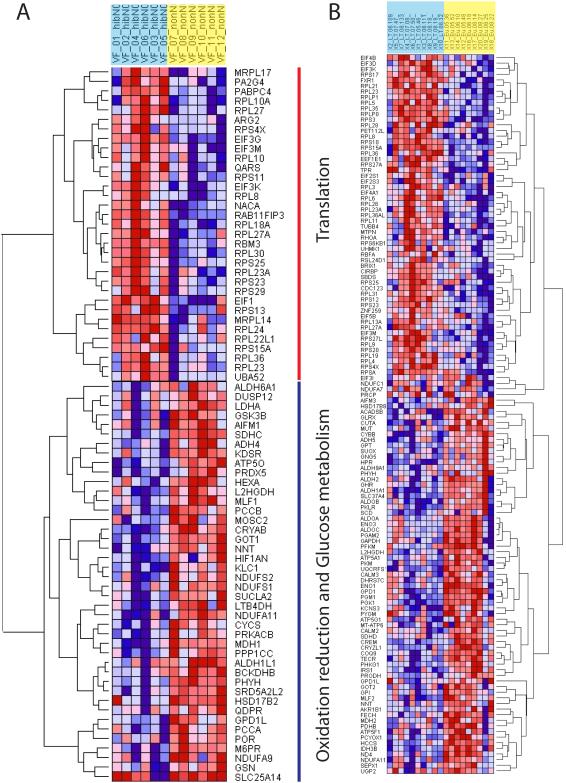
Figure 2.
Clustering and heat maps of expression values of genes involved in translation, glucose metabolism and oxidation-reduction GO category in skeletal muscle in black bears (A) and arctic ground squirrels (B). On the top hibernating animals are in blue and summer active individuals in yellow. Over-expressed genes are in red, under-expressed genes are in blue.

