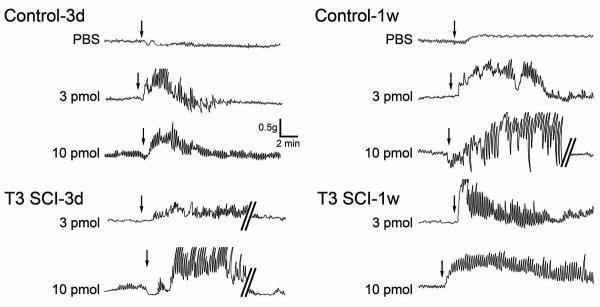
Figure 3. Representative original polygraph traces of gastric corpus contractions from control and T3-SCI.
Gastric corpus contractions following microinjection of vehicle (phosphate buffered saline, PBS), 3 pmol or 10 pmol of TRH into the left DVC of animals tested 3 days or 1 week after surgery. Arrows depict the initiation of microinjection for each respective dose. Selected traces are interrupted (denoted by parallel bars) to provide examples of gastric contractions following a return to baseline levels.

