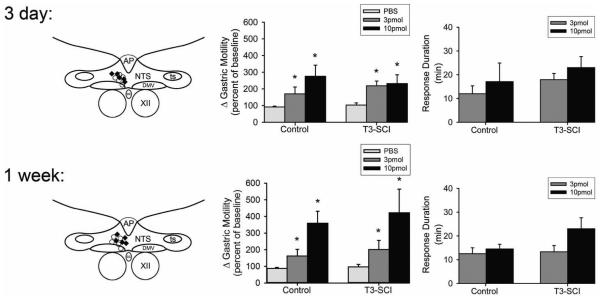
Figure 4. Microinjection of thyrotropin-releasing hormone into the dorsal vagal complex, including the DMV, induces gastric contractions following both control and T3-SCI.
Schematic representation of effective injection areas from 3 days (top left) and 1 week (bottom left) control (marked by ○) or T3-SCI rats (marked by ♦). For clarity, doses of TRH were pooled across surgical treatment groups and only a few examples of the distribution of injection sites are depicted. AP, area postrema; NTS, nucleus tractus solitarius; DMV, dorsal motor nucleus of the vagus; CC, central canal; XII, hypoglossus.
Graphic summary of the increase in gastric corpus motility induced by microinjection of PBS or TRH (3 or 10 pmol, expressed as percent increase from baseline) in the left DVC of 3 day (top center) control and T3-SCI (bottom center) subjects (n = 5 per group; *p < 0.05 vs pre-microinjection baseline). Duration of the response to microinjection of TRH (top and bottom right) was not significantly different between surgical treatment and dose at any time point (p>0.05).

