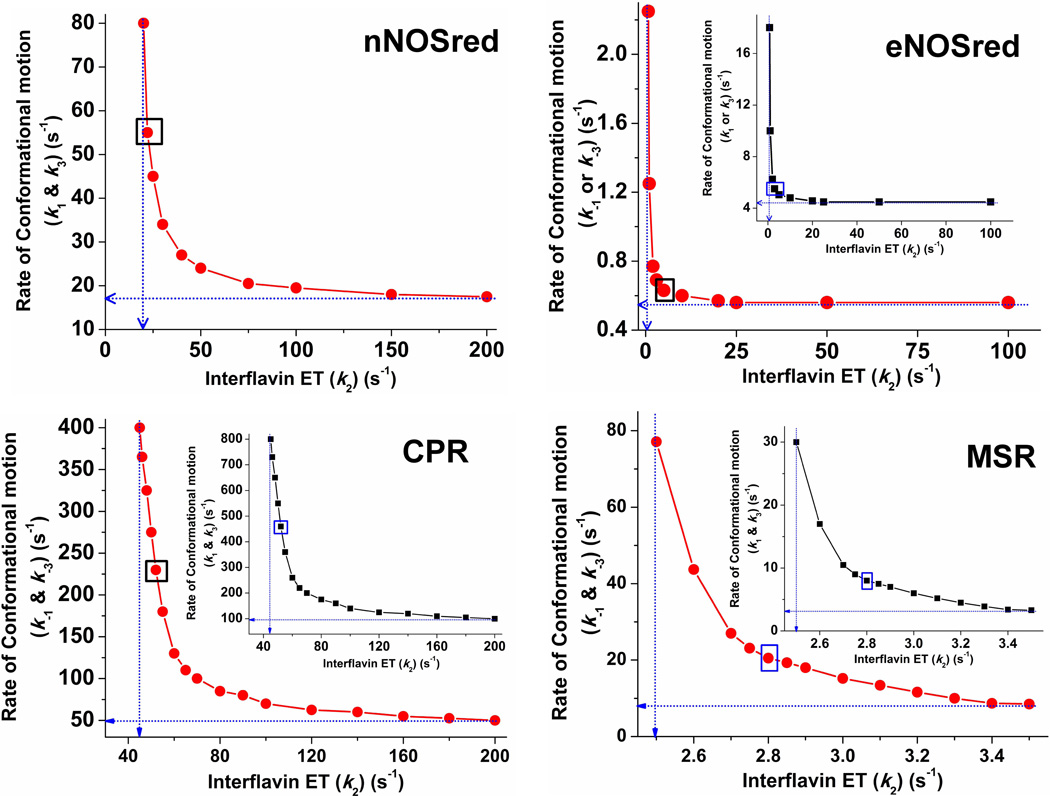
Figure 3. Conformational motion and interflavin electron transfer rate settings that support observed electron flux through dual-flavin enzymes.
Data were obtained from simulations of the kinetic model in Fig. 1. For a given k2 value, rates of conformational motion were screened for a value that yielded the observed electron flux. For all panels, blue dotted lines indicate the lower boundary values for the rates of conformational motion (Y-intercept) and interflavin electron transfer (X-intercept). For eNOSred, CPR, and MSR, the main panel shows the resulting values in terms of the conformational opening rates (k−1 = k−3). In the inset, the same data points are plotted, this time indicating the rates of conformational closing (k1 = k3) on the y axis. The boxed points in each panel indicate the best-fit rate pairs. For nNOSred, rates of conformational motion were screened for a given k2 value that yielded an electron flux of ~8 s−1 when Keq =1 and k1 = k−1 = k3 = k−3. In eNOSred conformational motion rates were set so that Khq = Ksq = 0.125 and the electron flux equaled 0.49 s−1. For CPR to achieve an electron flux of 28 s−1 and a Keq of 0.5, a number of k2 values were simulated in combination with different conformational motion rates. For MSR, rates of conformational motion were screened for a corresponding k2 value that yielded an electron flux of 0.7 s−1, while Khq = Ksq = 2.6, k1 = k3, and k−1 = k−3.

