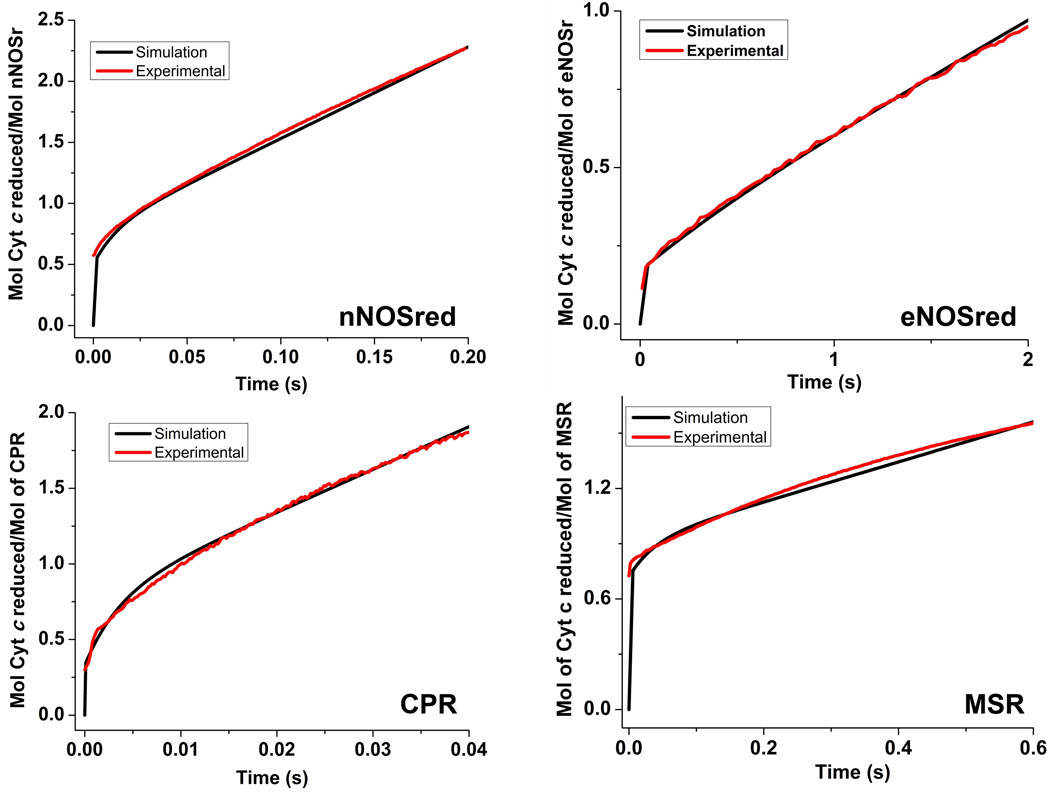
Figure 4. Simulated reactions of fully-reduced dual-flavin enzymes with excess cytochrome c.
The traces were obtained by simulating the kinetic model in Fig. 1, using different rates of conformational motion and interflavin electron transfer (k2) to match experimental traces for each of the four dual-flavins under study. Total protein concentration is 1.0, and the concentration of enzyme species d + a was set equal to 1.0 at time = 0 in the simulations. For nNOSred, conformational motion rates were set so that Khq = Ksq = 1, and k1 = k−1 = k3 = k−3. With these parameters, the closest match to the experimental traces in Fig. 2 was found when k1 = k−1 = k3 = k−3= 53, and k2 = 22. For eNOSred, conformational motion rates were set so that Khq = Ksq = 0.125, k1 = k3, and k−1 = k−3 = 0.125×k1. The best fit of experimental traces was found when the kinetic settings (s−1) were k1 = k3 = 5.0, k−1 = k−3 = 0.63, k2 = 5.0. In case of CPR the conformational motion rates were set so that Khq = Ksq = 0.5, k1 = k3, and k−1 = k−3 = 0.5×k1. The best fit was found when the kinetic settings (s−1) were k1 = k3 = 460, k−1= k−3 = 230, k2 = 52. For MSR, conformational motion rates were Khq = Ksq = 2.57 and k1 = k3;k−1 = k−3 = 2.57×k1. The best fit was found when the kinetic settings (s−1) were k1 = k3 = 8, k−1= k−3 = 20.5, k2= 2.8. Simulated traces (black lines) are overlayed with experimental traces (red lines).

