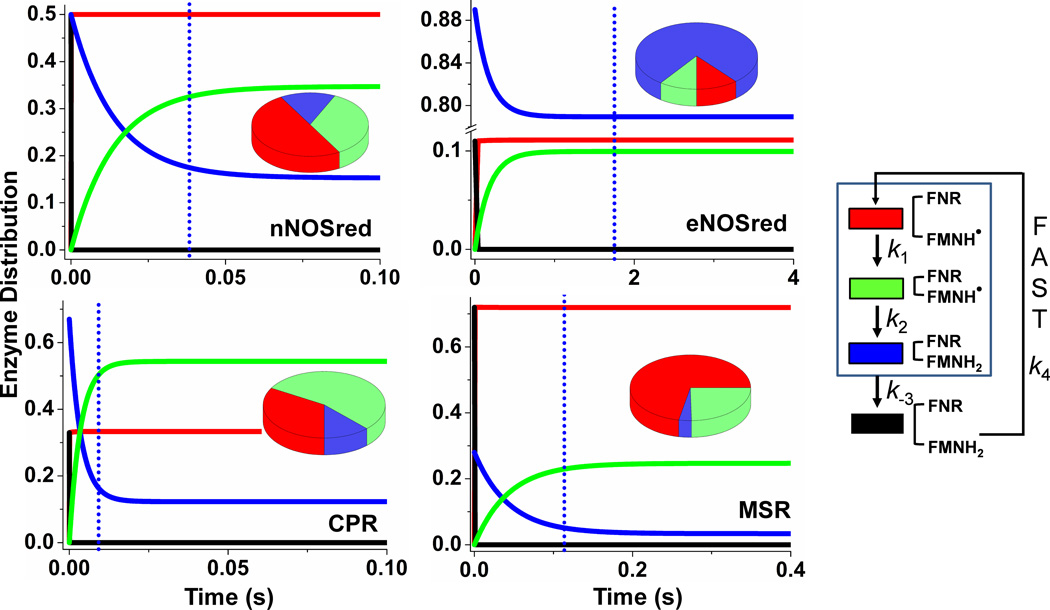
Figure 5. Patterns of enzyme distribution versus reaction time in dual-flavin enzymes.
Rate pairs of conformational motion and interflavin electron transfer (obtained from the simulated best-fit values (Fig. 4)) were used in each case to simulate and achieve experimentally obtained cytochrome c reduction rates. Lines indicate the relative concentrations of each enzyme species a-d (see Fig. 1), with the total enzyme concentration being 1.0 and the concentration of enzyme species d + a set equal to 1.0 at time = 0 in the simulations. The blue dotted line in each panel marks the time required for the enzyme to reduce one equivalent of cytochrome c. Kinetic settings were: For nNOSred: k1 = k−1= k3 = k−3 = 53, k2 = 22; For eNOSred: k1 = k−3 = 5.0, k−1 = k3 = 0.63, k2 = 5; For CPR: k1 = k3 = 460, k−1 = k−3 = 230, k2 = 52; For MSR k1 = k3 = 8, k−1 = k−3 = 20.5, k2 = 2.8. Pie graphs in each panel are showing different species distributed at steady-state. Color scheme for different species are as follows: species a: black, species b: red, species c: green, and species d: blue.

