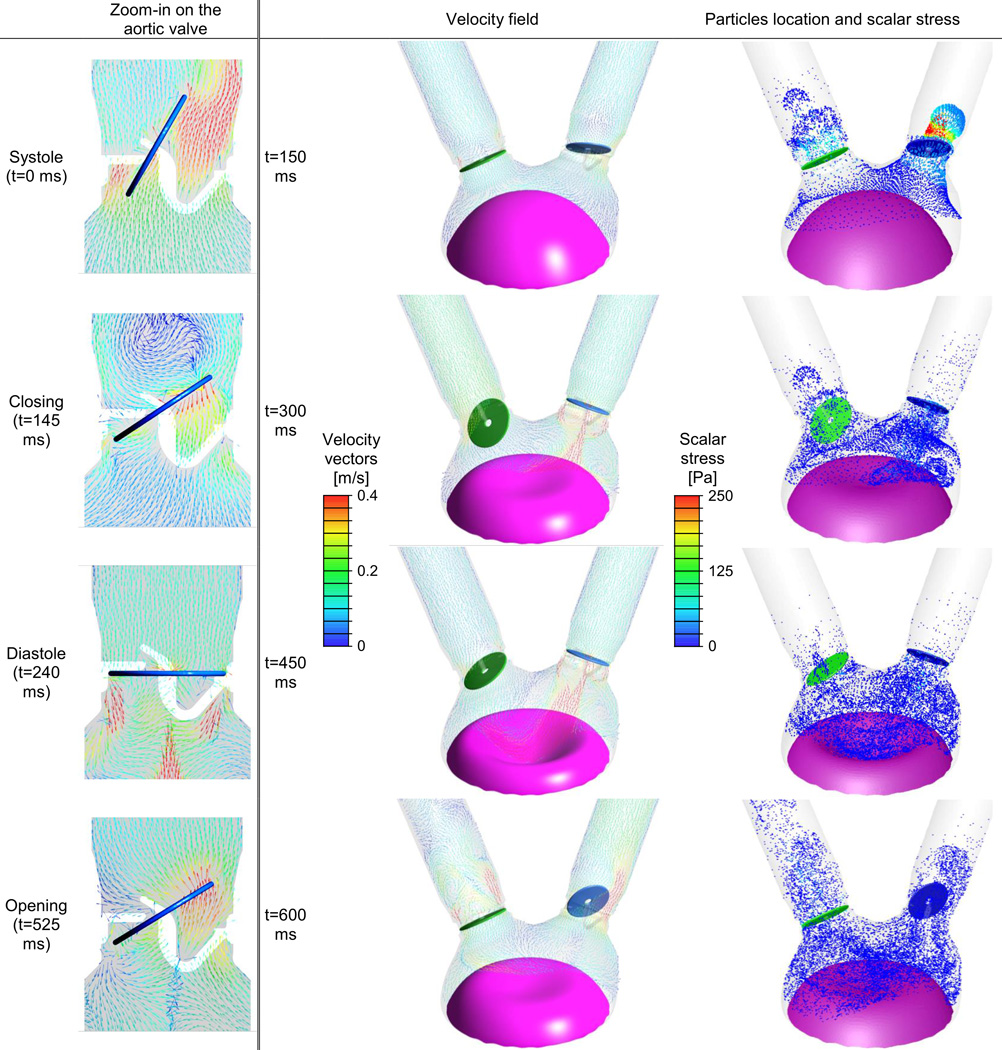
Fig. 6.
The 70 cc SynCardia TAH FSI model at four instances during the full cardiac cycle. Velocity vectors on two representative cross sections and platelet dispersion patterns with their local scalar (laminar and turbulent) stress magnitudes are shown in the first and second columns, respectively (Animation appears in the online version of this article)

