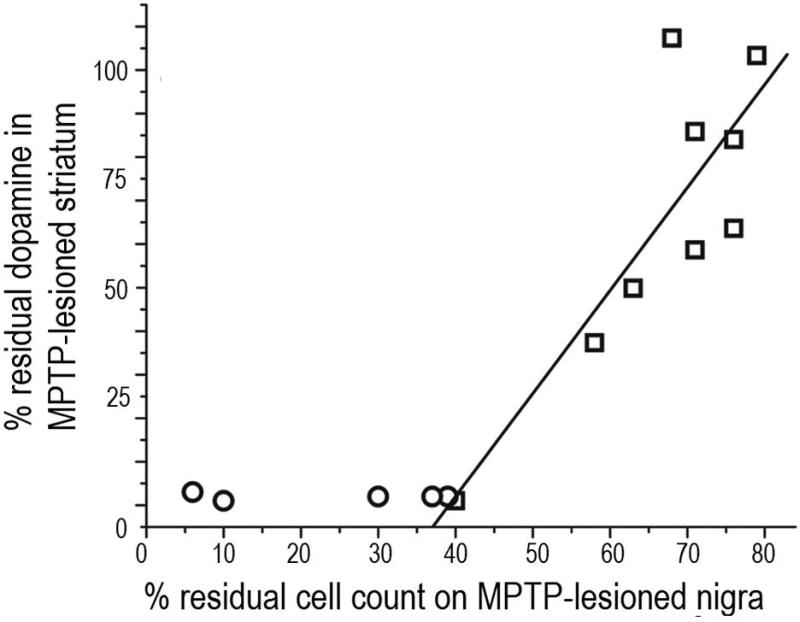
Figure 6.
Relationship between Striatal dopamine and and substantia nigra TH+ cell counts: Percent of residual dopaminergic cell counts (measured with unbiased stereology) in injected nigra (x-axis) versus percent residual dopamine (measured with HPLC) in the striatum (y-axis, n=14). Data from non-human primates with residual nigral cell counts of less than 50% are depicted in circles (n=5). Squares represent data from primates with residual nigral cell counts of 50% or more (n=9). Figure and legend adapted from Tabbal et al, 2012.26

