
Fig. 8.
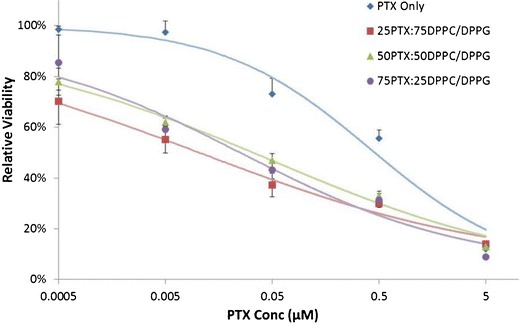
In vitro drug dose-response curves for A549 cells exposed to DPPC/DPPG particle formulations with varying concentrations of PTX after 48 h of exposure at 37°C. (n = 3, ave ± SD)
Official websites use .gov
A
.gov website belongs to an official
government organization in the United States.
Secure .gov websites use HTTPS
A lock (
) or https:// means you've safely
connected to the .gov website. Share sensitive
information only on official, secure websites.
In vitro drug dose-response curves for A549 cells exposed to DPPC/DPPG particle formulations with varying concentrations of PTX after 48 h of exposure at 37°C. (n = 3, ave ± SD)