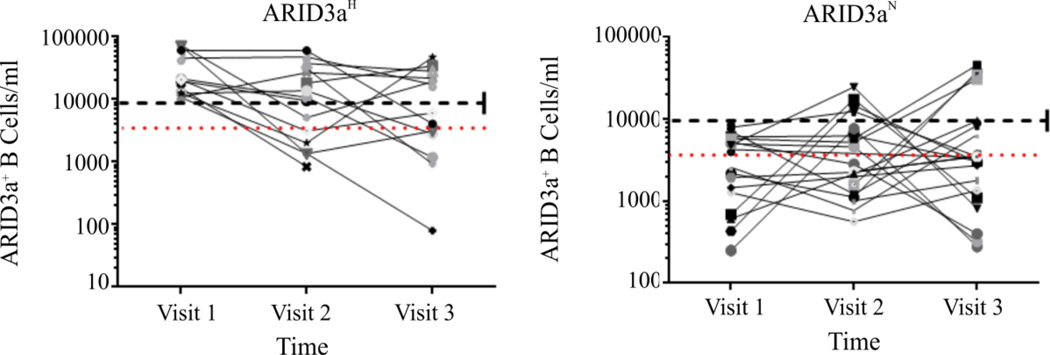
Figure 3. Numbers of ARID3a+ B cells in individual patients vary with time.
Numbers of ARID3a+ CD19+ B cells/ ml of blood from SLE patients subdivided based on total ARID3a+ B cells at their first visit (ARID3aH, n=15 or ARID3aN, n=22) were plotted for each visit. Each symbol represents one patient sample. Red dotted lines show mean numbers of ARID3a+ B cells from healthy controls; black dashed lines show the value used to designate samples as ARID3aH or ARID3aN.

