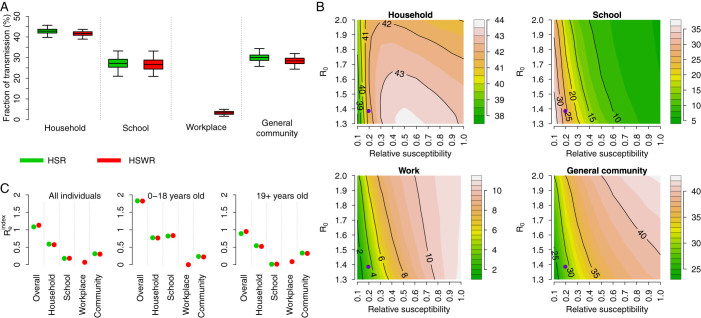
Figure 3. Influenza transmission in different social settings.
(A) Posterior distribution (mean, 50%CI and 95%CI) of the proportion of transmission in households, schools, workplaces and in the general community estimated with transmission models HSR (green) and HSWR (red). (B) Proportion of transmission in different social settings as obtained by simulating transmission model HSWR and by varying R0 and susceptibility to infection of adults (19+ year-old) relative to younger individuals. Violet points represent central estimates of Re and susceptibility to infection of adults for the 2009 H1N1 pandemic in Italy. Results are obtained by averaging over 1,000 model simulations for each pair R0-relative susceptibility. Color scale on the right side of each panel. (C)  , overall and in different settings, for all individuals (left subpanel), individuals aged 0–18 years (middle subpanel), and individuals aged 19+ years (right subpanel). Green points refer to model HSWR and red points to model HSR.

