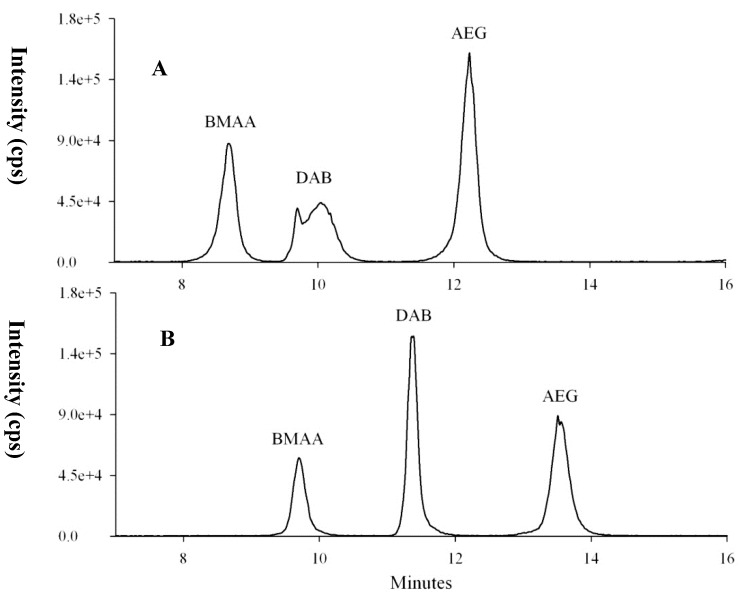
Figure 6.
The effect of the SPE clean-up on mussel matrix spiked with BMAA and AEG after extraction of free amino acids (DAB naturally present in the sample). The black line corresponds to the mass spectral transition m/z 119 > 102. (A) Spiked mussel extracted with TCA 0.1 M and injected in this solvent, while (B) the same sample subjected to PCX SPE clean-up and injected in ACN/water/FA. The shift in retention times compared to other chromatograms is due to the non-use of the guard column in (B) and due to the injection solvent, matrix effects and the non-use of a guard column in (A).

