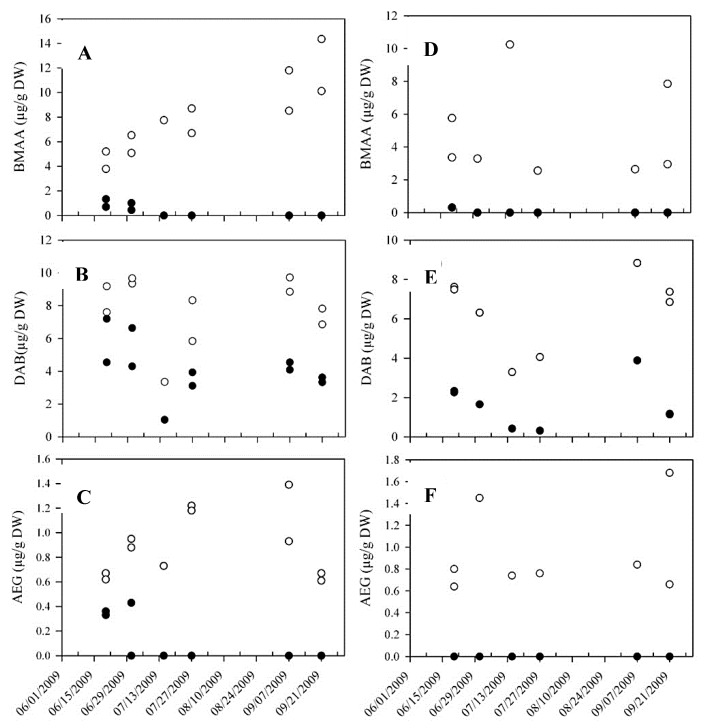
Figure 8.
(A–C) BMAA, DAB and AEG concentrations in free (black circles) and total form (empty circles) in mussels collected in 2009 and (D–F) in oysters. Mollusks were sampled in two of the three areas where shellfish were cultured in the lagoon and analyzed for both areas when material was available.

