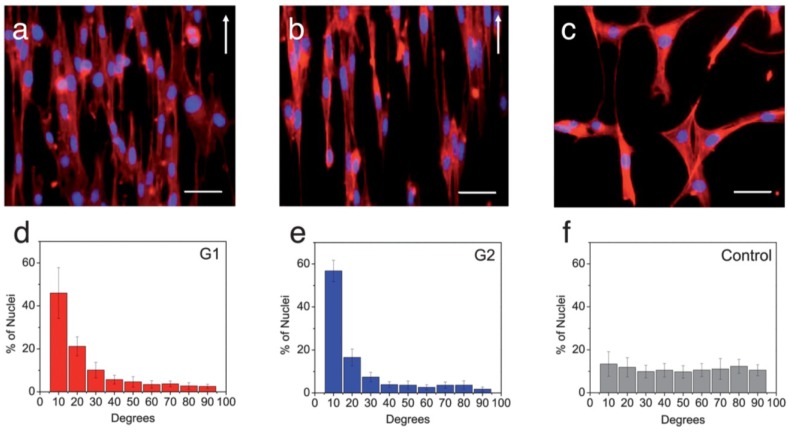
Figure 4.
Fluorescence images of the actin cytoskeleton of the cells on: (a) G1; (b) G2 support; and (c) control sample after five days of culture. Scale bars 50 μm. The white arrow shows the longitudinal direction of the patterns; (d–f) Distribution of alignment angles of cell nuclei on the patterned samples and control. Note: G1 is a pattern with 3.2 μm spacing (smaller than the average cell diameter) and G2 with 11.2 μm spacing (slightly larger than the average cell diameter). Reprinted with permission. Copyright © 2013 Elsevier [78].

