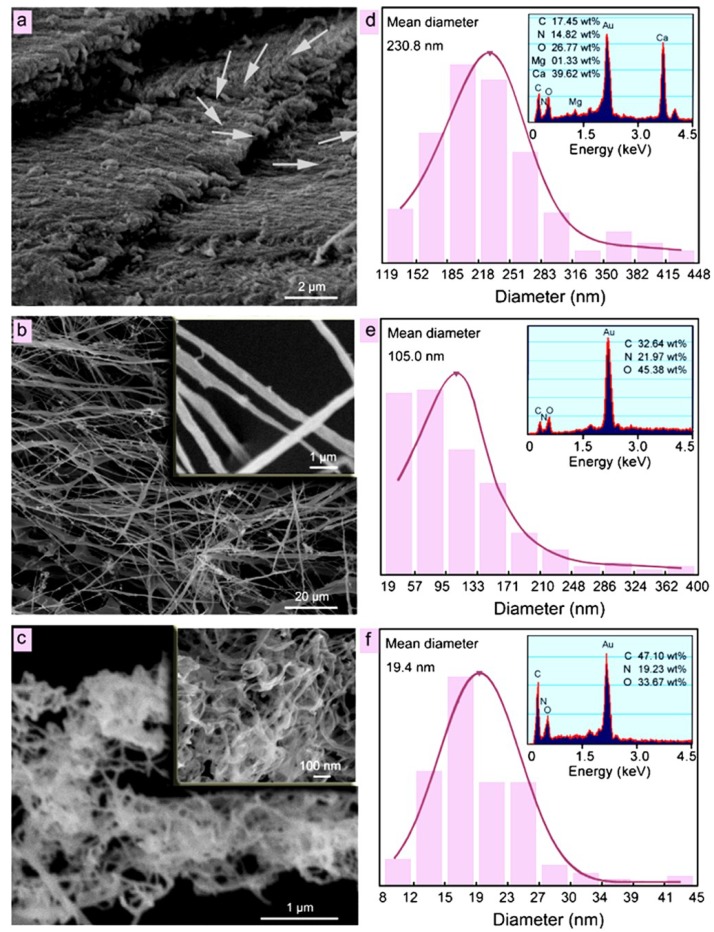
Figure 5.
SEM micrographs of (a) dry shell; (b) after 5 min sonication; and (c) after 30 min sonication; (d–f) are the distributions of the fiber diameters respectively, and insets are EDS spectra. Reprinted with permission. Copyright © 2013 Elsevier [94].

