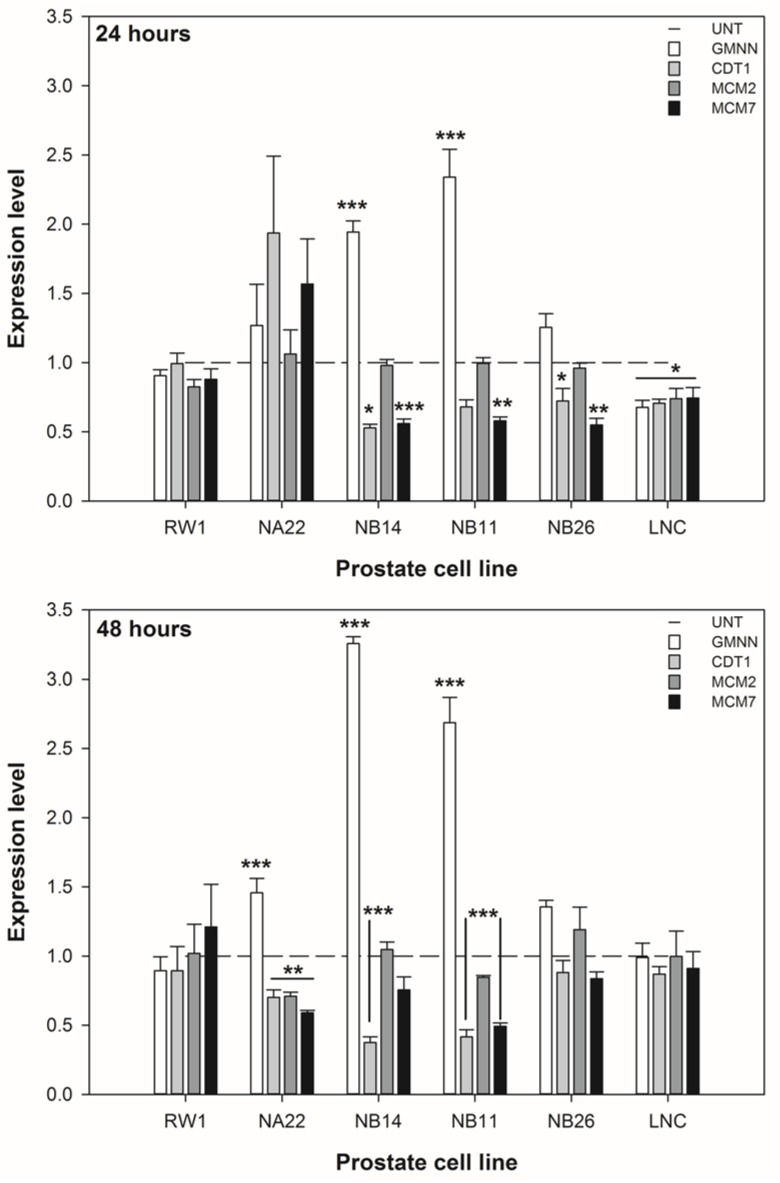
Figure 5.
The effect of 20 μM ENL on the expression of DNA licencing genes by prostate cell lines over 48 h. The data are expressed as the mean expression level ±SEM (n = 3). For each cell line, a difference between untreated and treated samples is indicated by * (p < 0.05), ** (p < 0.01), or *** (p < 0.002).

