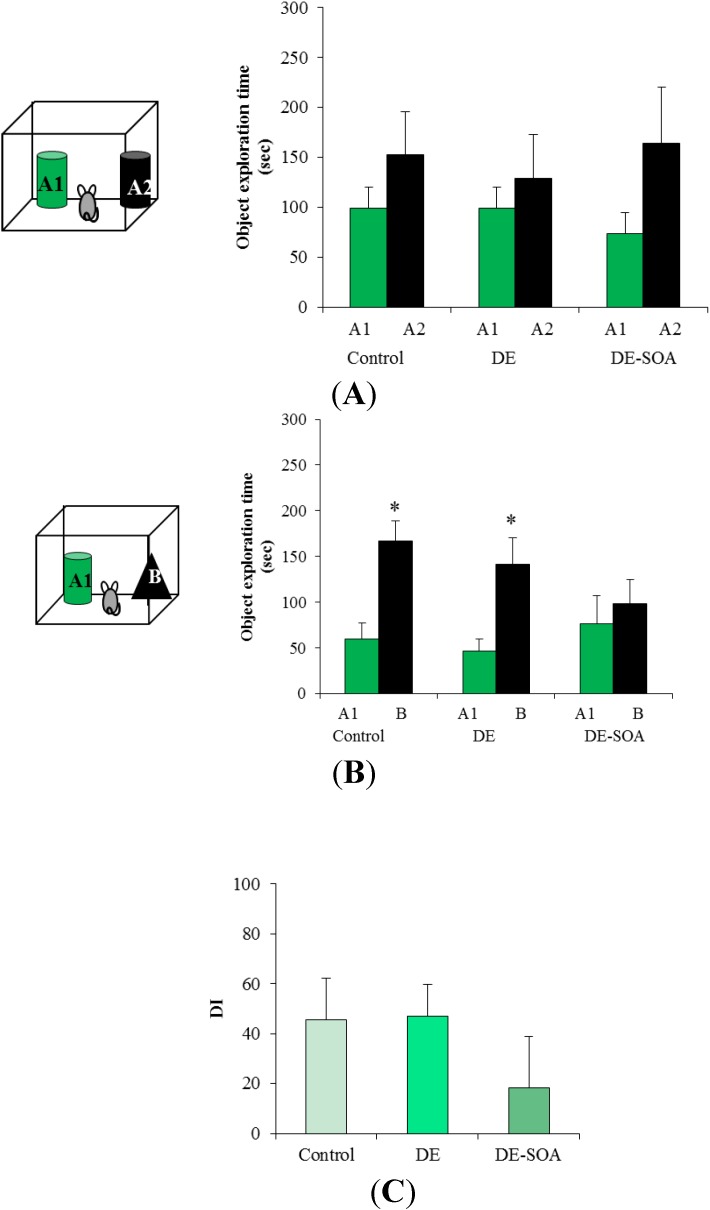
Figure 1.
DE-SOA impaired novel object recognition ability after one month exposure. (A) Training phase, (B) test phase and (C) discrimination index in the control, DE and DE-SOA exposed mice. Each bar represents the mean ± SE. A1 and A2 are identical raccoon dog toys and B is bear toy.
Notes: n = 8, * P < 0.05, paired t test, A1 and B in the control and DE exposed groups in test phase.

