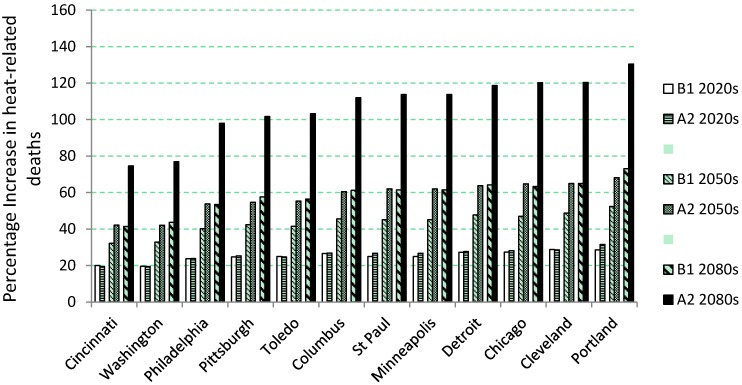
Figure 2.
Percentage increase in heat-related deaths during 2020s, 2050s and 2080s compared to the 1980s baseline period for the twelve cities. Calculated across the 16 global climate models (GCMs) used in this study and displayed separately for the low emissions (B1) and high emissions (A2) scenarios.

