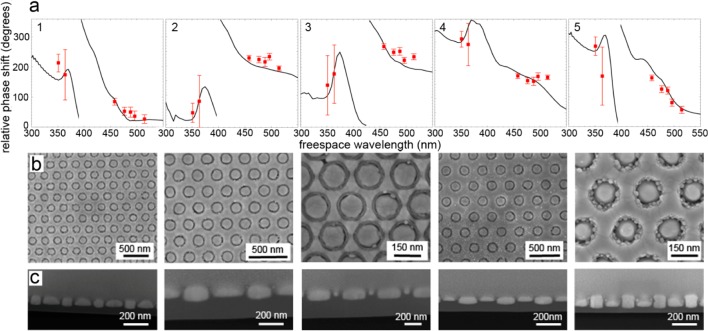
Figure 4.
Coaxial metamaterial phase measurements and geometries. (a) Experimentally measured phase shifts for different wavelengths on 5 metamaterial samples (Table 1, samples 1–5, red dots), derived from phase histograms as in Figure 3. Phase shifts obtained from FDTD simulations for the corresponding geometries are shown as solid lines. (b) Top-view SEM and (c) cross-section SEM images of the sample. A layer of Pt is deposited on the metamaterial samples to make the cross sections panel c.

