
Figure 4.
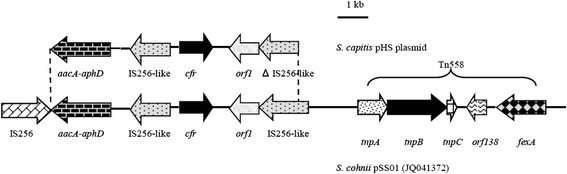
Schematic representation of the genetic environment of cfr in pHS and pSS-01. The arrows indicate the positions and directions of the transcription of the genes. The regions of homology between pHS and pSS-01 (GenBank accession no. JQ041372) are indicated by dashed lines and grey shading. Δ indicates a truncated gene.