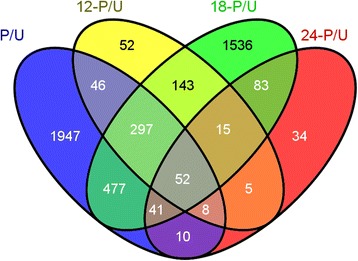
Figure 4.

VENN diagram of differentially expressed genes. A VENN diagram displaying the overlapping differentially expressed genes identified from pairwise comparisons of pollinated and unpollinated libraries at all time points (P/U) and of pollinated and unpollinated libraries at 12, 18, and 24 h (12-P/U, 18-P/U and 24-P/U, respectively).
